GDP Estimates
Supply, Use and Input-Output Tables (SU-IOTs)
Consumer Price Index
Producer Price Index
Personal Disposable Income and Personal Saving
What is balance of payments (BOP)?
Singapore's BOP is a statement that summarises the economic transactions between Singapore residents and non-residents. These transactions occur during a specific time period. It consists of the current account, and the capital and financial account.
What is external debt?
Singapore's external debt is the outstanding amount of actual current, and not contingent liabilities owed to non-residents by Singapore residents. The values reflected are as at a point in time. It is also part of external liabilities in Singapore's international investment position (IIP).
What is international investment position (IIP)?
Singapore's IIP is a statement that shows the value and composition of cross-border financial assets and liabilities of Singapore at a point in time. Financial assets and liabilities comprise mainly three broad categories (1) equity and investment fund shares, (2) debt instruments, and (3) other financial assets and liabilities such as financial derivatives.
The difference between Singapore's external financial assets and liabilities is Singapore's net IIP, which may be positive or negative. A positive net IIP would mean that an economy is a net creditor to the rest of the world while a negative net IIP would indicate that an economy is a net debtor to the rest of the world.
What makes up the household sector in the Household Sector Balance Sheet?
Household sector in the Household Sector Balance Sheet refers to all household institutional units that have engaged in economic activities in Singapore for at least a year, including:
- Singapore citizens
- Permanent residents
- Foreigners
- Unincorporated enterprises (e.g., sole proprietorships)
Data on the household sector balance sheet are compiled on an aggregated basis from a macro perspective. Hence, data on mean/median household wealth, assets and liabilities, by household and socio-demographic characteristics and by income or wealth deciles are not available.
What are growth cycles and the Composite Leading Index?
In the business cycle literature, there are three types of cycles, namely: the classical cycle, growth cycle and growth rate cycle. Singapore’s economic activity is characterised by growth cycles, rather than classical cycles or growth rate cycles as it has generally been on an upward trend with relatively stable growths. Growth cycles are fluctuations in the growth rate of an economy. Since the 1985 recession, six growth cycles have been identified for the Singapore economy. The dates of peak and trough are identified from the growth cycles via statistical algorithms.
The Composite Leading Index (CLI) is a predictive tool to anticipate upturns and downturns in the economy and to gauge if, and approximately when, an expansion or recession will take place. Singapore’s CLI comprises nine economic indicators that exhibit leading relationships with the growth cycles of the economy. These leading indicators have been selected based on a set of key criteria including economic significance, cyclical properties, timeliness, periodicity, and statistical quality of the data series.
For more information, you may refer to the information paper on Singapore’s Growth Cycle Chronology, Coincident and Leading Indicators. For latest updates to the growth cycle chronology, please refer to the Statistics Singapore Newsletter Issue 2, 2023 article.  (792 KB)
Why is there a huge difference in Economic Development Board (EDB)’s data on Principal Statistics of Manufacturing by Industry Cluster – Employment and Ministry of Manpower (MOM)’s data on Annual Employment Level – Manufacturing? Which one should I use?
EDB’s employment data are compiled from their Annual Census of Manufacturing survey (CMA). The CMA gathers data on the entire industrial sector with establishments engaging in activities of manufacturing and industrial servicing. These activities are classified in Section C of the Singapore Standard Industrial Classification (SSIC) 2020 edition. EDB's data are survey based and based on a representative sample of manufacturing establishments, i.e., not all manufacturing firms in Singapore are covered. Firms with more than 20 workers are surveyed with certainty while firms with lesser than 20 workers are sampled. More information on CMA are available at Report Census of Manufacturing Activities.
For policy decision making purposes, it is more appropriate to use employment data from administrative sources i.e., MOM, as they are the official source for manpower statistics. For clarifications on the CMA results, you may contact EDB at rsu@edb.gov.sg.
MOM’s data on number of workers employed in the manufacturing sector are compiled primarily from administrative records, with the self-employed component estimated from the Labour Force Survey. The employment data are as of year-end, i.e. end-December of each year. More information on the source and coverage are available on MOM’s Website. For clarifications, you can contact MOM at mom_rsd@mom.gov.sg.
What is seasonal adjustment, and the significance of seasonally adjusted (SA) data in time series analysis?
Seasonal adjustment is the process of estimating and removing the calendar and seasonal effects from a time series so as to show its underlying trend and short-term movements clearly. The seasonally adjusted time series facilitate a better assessment of their recent movements, including the timely identification of turning points.
Our Department adopts the X12-ARIMA procedure in carrying out seasonal adjustments, which is developed by the US Census Bureau and widely used among national statistical offices and international agencies.
The procedure works on a basis of iterative estimations, alternately estimating the trend-cycle and seasonal components using various moving-average filters, before finally deriving the estimates of the seasonally adjusted series.
The non-seasonally adjusted (NSA) data show the actual economic events that have occurred, while the seasonally adjusted (SA) data represents an analytical elaboration of the data designed to show the underlying movements that may be hidden by the seasonal variation. SA series is especially useful during instances where the NSA series contains strong seasonal patterns which may hinder detailed in-depth data analysis. SA data facilitates analysis by supplementing the information presented by the NSA data.
It is possible that the non-seasonally adjusted (NSA) data shows an increase over the previous month but the seasonally adjusted (SA) data shows a decrease, when the increase is less than the usual seasonal increase. To illustrate, consider the retail sales index (RSI) which tends to increase sharply in December during the festive season. Suppose that an economic downturn results in a weak performance of the retail sector, the unadjusted RSI for December might still show a moderate increase over November. But because this increase is lower than that for a typical December, the seasonally adjusted RSI for December would be lower than the corresponding seasonally adjusted RSI for November.
For more information on seasonal adjustments of time series, you may refer to the Information Paper on Seasonal Adjustment of Economic Time Series. (254 KB)
You could also refer to the article on Seasonal Adjustments of Time Series (31 KB)
.
Does the Gross Domestic Product (GDP) capture unpaid work such as volunteering?
GDP measures the market value of the goods and services produced in an economy. In line with international statistical standards outlined in the System of National Accounts, GDP does not include unpaid work such as volunteer work. Economies, including Singapore, follow these standards when computing GDP to ensure the international comparability of estimates.
Nonetheless, the value of volunteer work may be monitored through indicators beyond GDP, such as volunteering rates, hours volunteered, which are published by the National Volunteer & Philanthropy Centre.
Why are recent-period GDP estimates revised?
Quarterly GDP estimates of year T are initially compiled using a wide range of timely short-term indicators of economic activities in each industry. These estimates offer a snapshot of the current economic situation for macroeconomic policymakers & analysts and comes prior to the availability of comprehensive annual survey benchmarks. Sources of these indicators used include high frequency administrative data and short-term survey data obtained from a relatively small number of companies or establishments.
As more comprehensive data on the full quarter’s performance become available, these are incorporated in subsequent updates, ensuring that the estimates reflect the most accurate and up to date picture of economic activity.
Why are there revisions to GDP estimates of earlier years?
A comprehensive review of the GDP estimates, initially compiled from timely short-term indicators, occurs in year T+1 during the annual Economic Survey (ESS) exercise, incorporating comprehensive annual survey benchmarks and up-to-date administrative data.
Survey benchmarks are a comprehensive set of data compiled from aggregated establishment survey returns, typically available with a time lag of one to two years. Consequently, larger revisions are generally observed for recent-period data. Revisions also occur as GDP estimates by the three approaches (i.e., production, expenditure & income) are rebalanced and reconciled based on the updated annual supply and use tables.
This is elaborated in the table below.
Table 1. GDP revision process across annual ESS publications
| Annual ESS Publication |
Description |
| ESS Year (T) |
The first-available annual GDP estimates (T) are compiled using a wide range of timely short-term indicators of economic activities in each industry. Sources of these indicators include administrative and short-term survey data. These timely estimates provide a snapshot of the current economic situation for macroeconomic policymakers & analysts.
The compilation of statistics generally involves a trade-off between timeliness and accuracy. Revisions are expected as more comprehensive information becomes available over time. |
| ESS Year (T+1) |
A comprehensive review of the GDP estimates occurs annually during which annual survey benchmarks and up-to-date administrative data are incorporated (T+1).
Survey benchmarks are a comprehensive set of data compiled from aggregated survey returns from establishments.
These benchmarks are typically only available 9 to 15 months after the reference period, as detailed survey results follow after companies have compiled full financial details from their operations and filed statement of accounts. |
| ESS Year (T+2) |
In year T+2, the GDP estimates are further revised to incorporate updates to firms’ survey returns. These updates could be due to late and/or revised returns from some firms.
Additionally, GDP estimates compiled by the three approaches (i.e., production, expenditure & income) are also reconciled based on the annual supply & use tables (SUTs at T+2). This process balances the production and consumption of goods and services in the economy, aligning the GDP estimates from different approaches more closely. |
| ESS Year (T+3) and beyond |
Fewer revisions are anticipated in subsequent ESS, unless significant changes occur in survey data, methodologies, or international frameworks. In particular, GDP estimates may be revised during periodic benchmarking exercises which reconcile the estimates of GDP by the three approaches (production, income and consumption) and provide the occasions for methodological and conceptual reviews and improvements. |
For more information on revisions to GDP estimates, please refer to DOS’ publication on the Analysis of Revisions to GDP Estimates, available at Analysis of Revisions to Gross Domestic Product Estimates.
What is the output multiplier?
The output multiplier represents the total output produced by all industries in response to a dollar increase in final demand for an industry's output. There are 2 types of output multipliers - simple and total.
For more information, you may view the Output Multiplier infographic. (385 KB)
How are the Input-Output Tables (IOTs) used?
Input-Output Tables (IOTs) can be used to simulate the economic impact due to changes in final demand, such as from policies implemented, on key aggregates like Output, Value-Added and Compensation of Employees. You may refer to the article on Using Input-Output Tables in Simulation (553 KB) for an illustration on using the IOTs in simulation.
Another use of the IOTs is measuring economic interdependency:
Backward and forward linkages measure the economic interdependence between industries.
For more information, you may view the Connecting the Dots Between Industries: Linkages infographic. (228 KB)
What is the Value-Added (VA) multiplier?
The VA multiplier represents the total VA generated by all industries in response to a dollar increase in final demand for an industry’s output.
What is Consumer Price Index (CPI)?
The CPI is designed to measure the average price changes of a fixed basket of consumption goods and services commonly purchased by resident households over time. It measures price movements (i.e., changes in prices) but not absolute price levels at a point in time.
How is the CPI used?
- As a measure of consumer price inflation
- As inputs in the formulation of government policies
- As a means of deriving real values in the compilation of economic statistics
How often is the CPI rebased?
The CPI is rebased once every five years to reflect the latest consumption patterns and composition of goods and services consumed by resident households. The latest base year for the CPI is 2024.
What does the CPI basket cover?
- Consumption expenditure incurred by resident households are covered in the CPI
- Includes goods and services commonly purchased by resident households from a wide range of retailers and service providers
- About 6,800 brands/varieties from 4,500 outlets are selected in the 2024-based CPI
How are the CPI weights derived?
The CPI weights reflect the relative importance of each good or service in the basket. The weighting pattern for the 2024-based CPI was derived from the expenditure values obtained from the Household Expenditure Survey (HES) 2023, and updated to 2024 values by taking into account price changes between 2023 and 2024.
How are the annual (yearly), quarterly and half-yearly CPI derived from the monthly CPI?
As the CPI is compiled on a monthly basis, the yearly index is derived by taking a simple average of the 12 months’ indices for the year. Likewise, the annual inflation rate for any year is computed by taking the ratio of the index for the current year compared with that of the preceding year.
Similarly, the derivation of the quarterly and half-yearly indices and inflation rates are computed accordingly based on their corresponding monthly indices.
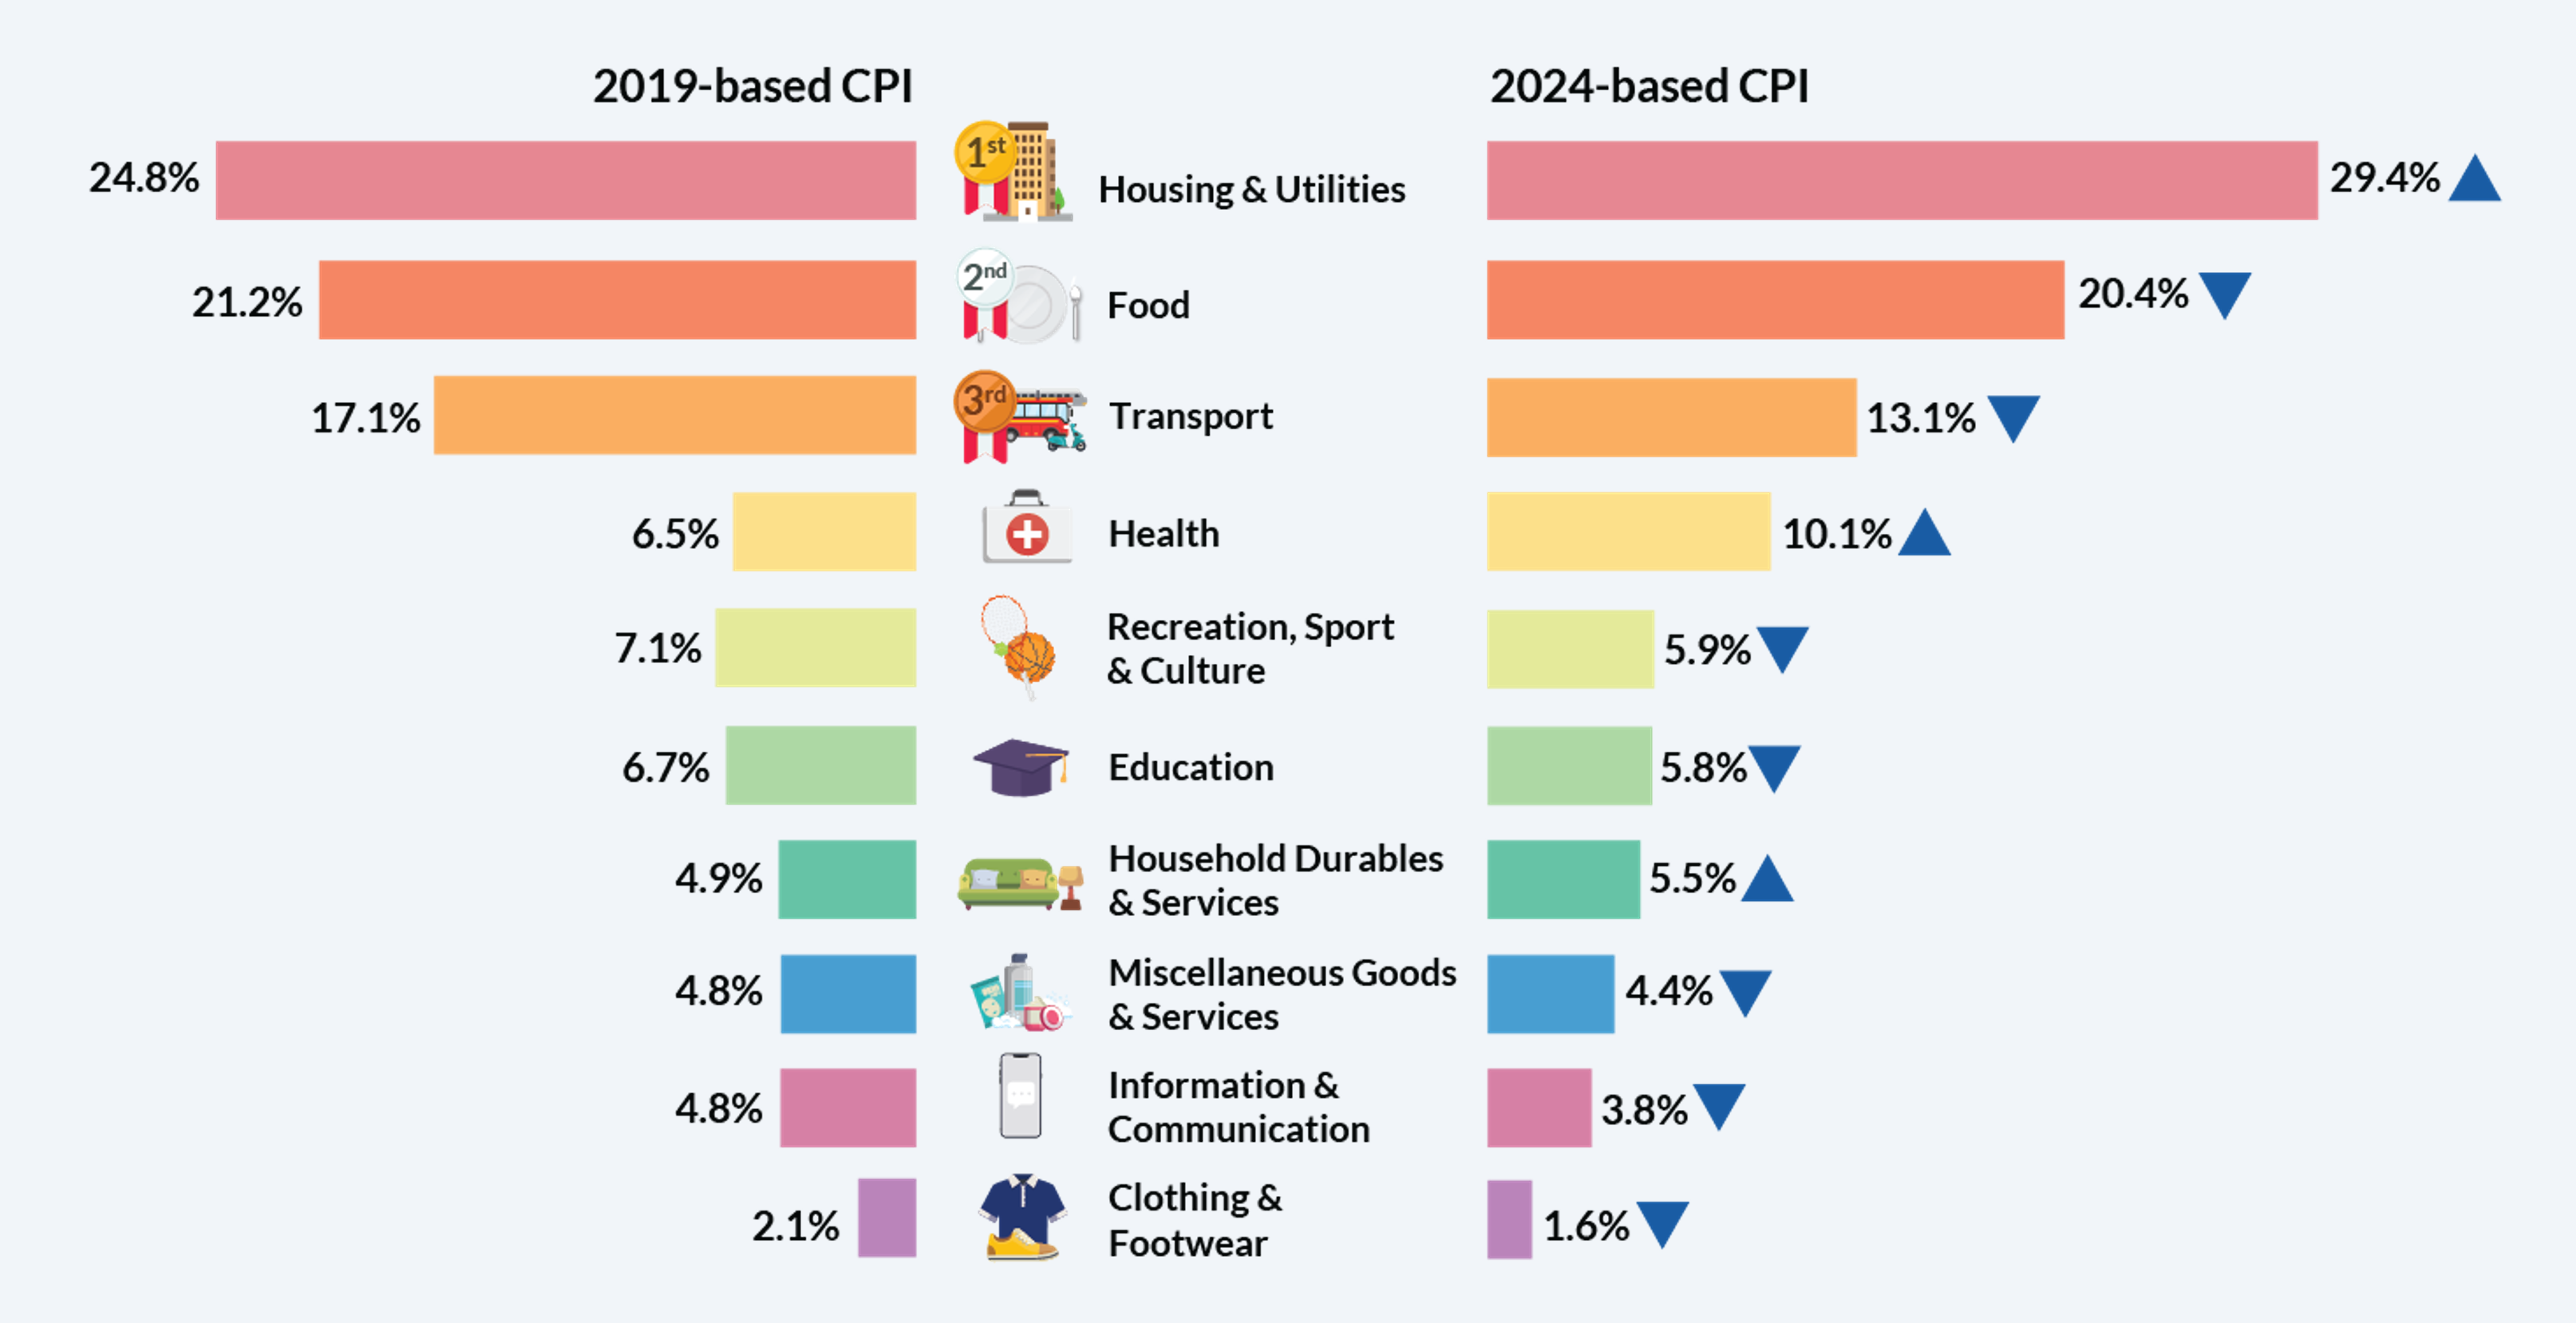
What is the weighting pattern for 2024-based CPI for general households?
What are Imputed Rentals for Housing Index in the CPI?
Accommodation, one of the groups in the Housing & Utilities expenditure division of the CPI, comprises Actual Rentals for Housing, Imputed Rentals for Housing, as well as Housing Maintenance & Repairs.
A significant share of the Accommodation group is Imputed Rentals for Housing, which reflects the costs to homeowners of utilising the flow of services provided by their homes over an extended period of time. Given the cost of using housing services is not directly observed for homeowners, it is computed based on the imputed rental concept under the rental equivalence method, i.e. proxied by market rentals of similar properties. This provides an estimated rental value for the owned home, as though the homeowners were renting it from themselves. Housing price is not considered in the CPI as it has a high investment component and is treated as a capital good.
Imputed Rentals have no impact on the cash expenditures of most households in Singapore as they already own their homes.
How are CPI prices collected?
- Prices are obtained via postal/email enquiries, electronic returns, webscraping data or Application Programming Interface (API) from relevant websites and administrative data. Prices of perishable food items and those at hawker centres, coffee shops and food courts are collected by field interviewers using handheld devices.
- The frequency of data collection depends on the price behaviour of the good or service. Prices of goods and services that are more prone to fluctuations (e.g. perishable food items such as fish, seafood and vegetables) are collected more frequently to obtain more reliable estimates of price changes. Those with more stable prices such as Service and Conservancy Charges (S&CC) for Housing and Development Board (HDB) flats, utility tariffs, bus/train fares, school fees, medical services and household durables are priced monthly, quarterly, half-yearly, yearly or as and when the prices/rates change.
Why is my inflation experience different from the CPI?
The CPI reflects the collective experience of inflation for all resident households. It may not correspond to the inflation experience of any particular individual or household as spending patterns are unique.
Depending on the goods and services purchased by each individual household, changes in prices will impact each household to a different extent. Those who spend more on those items with rapid price increases will feel a greater impact of inflation than others, and vice versa.
For more information, you may view the Why does the Reported Inflation Differ from My Personal Experience? Infographic.
When is the CPI released?
The CPI is released on the 23rd of every month, or on the following working day if the 23rd falls on a weekend or a public holiday.
Is ‘Shrinkflation’ accounted for in the CPI?
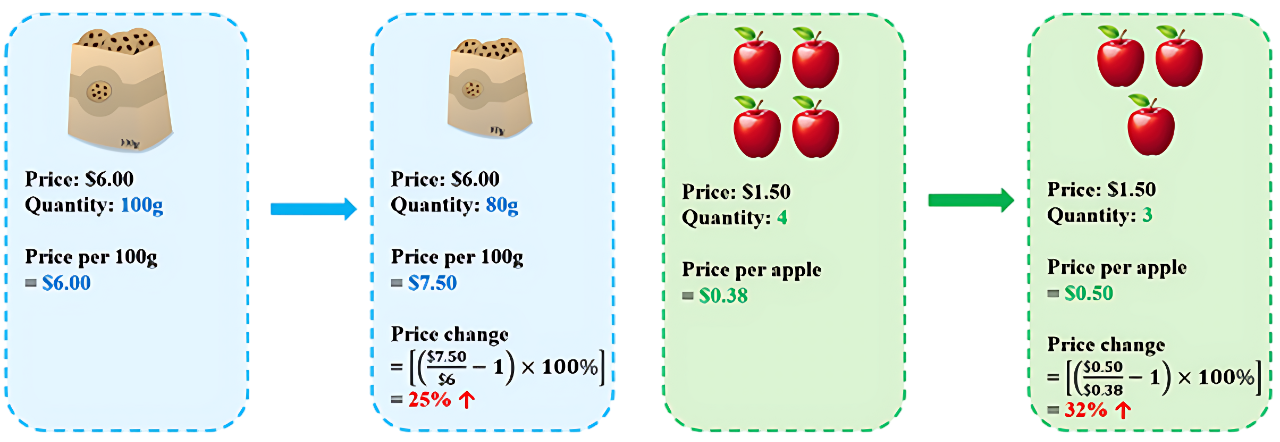
Products priced in the CPI basket may change in terms of quantity or packaging size over time. When a smaller quantity of a product is sold for the same price, there is an implicit price increase. This is known as ‘Shrinkflation’, where consumers are paying the same amount of money but getting less. The CPI accounts for such changes in quantity, where possible, by adjusting the price data of the items based on a fixed unit of measurement (e.g. price per 100g).
Figure below illustrates how the CPI accounts for ‘Shrinkflation’.
Does government assistance impact the CPI?
Various government schemes have been introduced over the years to support individuals and households, especially the lower income groups. These measures vary from cash or near-cash support, which are considered income transfers and are out of scope of the CPI, to those that directly lower the final prices faced by individuals and households which are hence reflected in the CPI.
Some relevant measures impacting the CPI include Financial Assistance Scheme (FAS) from the Ministry of Education (MOE), Community Health Assist Scheme (CHAS) subsidies, Service and Conservancy Charges (S&CC) rebates, levy concession for migrant domestic workers, road tax rebates, preschool subsidies for infant care, childcare and kindergartens, etc.
What is Producer Price Index (PPI)?
PPIs measure the rate of change in prices of products/services sold as they leave the producers. They exclude any taxes, transport and trade margins that the purchaser may have to pay. PPIs provide measures of average movements of prices received by the producers of various products and services. They are often seen as advanced indicators of price changes throughout the economy, including inflation as measured by the Consumer Price Index (CPI).
For the full list of PPIs that the Department of Statistics currently publishes, you may refer to SingStat Table Builder via the following selections: Economy & Prices >> Prices and Price Indices >> Producer Price Indices (DSPI, SMPPI and SPPI).
Where can I find the producer and international trade price indices at the industry level?
The producer and international trade price indices are not available at the industry level. Producer and international trade price indices are compiled according to the commodity groups as defined by the international classification: Standard International Trade Classification (SITC) Rev. 4.1
Why are rebasing exercises conducted?
A rebasing exercise is conducted periodically to ensure that the weighting structure and coverage of products measured in the price index are representative of the current activities and market share of the industry.
To find out more about the weighting structure for PPIs, you may refer to the information papers on the rebasing of PPIs.
Does personal disposable income (PDI) compiled by the Department of Statistics (DOS) refer to individuals’ take-home pay, i.e. salary less income tax?
PDI, which is compiled based on the System of National Accounts (SNA), comprises the following:
- Remuneration or compensation of employees (CoE)
- Self-employment income
- Gross operating surplus on ownership of dwellings* and non-profit institutions serving households (NPISHs)
- Net property income received (e.g. interest and dividends)
- Net current transfers received
- Less personal income tax paid
Hence, PDI does not refer to individual's take-home pay. For example, the coverage of CoE includes both employers and employees contributions to the Central Provident Fund (CPF), a mandatory social security savings scheme.
Net property income is the difference between property income received and property income paid. It does not relate to income from owning a residential property. Rental income from residential property is recorded under item (3). Households’ property income mainly refers to income (e.g. interest and dividends) receivable by owning financial assets (e.g. deposits and shares).
Net current transfers received is the difference between current transfers received and current transfers paid. Examples of current transfers include government support measures in cash/CPF top-ups to individuals/households (e.g. Assurance Package – Cash, GST Voucher– Cash, one-off MediSave Bonus and Retirement Savings Bonus under the Majulah package) and transfers with the rest of the world (e.g. remittance). As PDI measures monetary resources available to the households, other types of government transfers which are provided in kind to the households (e.g. CDC vouchers, U-Save for utility bills, and services & conservancy charges rebate), are treated as social transfers in kind in SNA and not included in PDI.
* Gross operating surplus on ownership of dwellings refers to actual and imputed rental less operating expenses of housing services. Consistent with international practice, an imputation to the rental of owner-occupied dwellings is made so that the treatment is comparable to the actual rental of tenant-occupied dwellings.
Information on individual income can be found from the Ministry of Manpower’s Labour Force Surveys.
Household income can be found from the Department of Statistics’ key household income trends reports and the household expenditure survey reports.
Does the personal disposable income (PDI) data include only Singaporeans and Permanent Residents?
PDI is compiled based on SNA’s notion of “economic resident”, i.e. an individual/entity who has a predominant centre of economic interest in an economy/country. As such, Singapore’s PDI includes Singapore citizens, permanent residents, foreigners and who have their main economic interest in Singapore, typically meaning they live and work here for at least a year. This differs from the term “resident households” used in household income, which refer to households where the household reference person is a Singapore citizen or permanent resident.
In addition, PDI covers unincorporated enterprises (e.g. sole proprietorships) and private non-profit institutions serving households (e.g. charities and religious organisations) which provide goods and services to household for free at subsidised rates.
What is personal saving and how does it differ from bank savings?
Personal saving in national accounts refers to the difference between personal disposable income and private consumption expenditure on goods and services. It differs from the common perception of bank savings, which often refers to the amount of deposits in bank accounts. Instead, personal saving is the amount of available funds after consumption and before the purchase of assets or repayment of debts.
Personal disposable income measures the income of the personal sector (e.g., compensation of employees, self-employment income, gross operating surplus on ownership of dwellings and private non-profit institutions), after accounting for net property income received (i.e., interests and dividends), net current transfers received and personal income tax paid.